Table 1: Number of MJO events as a function
of season for 1979-1993. 12
_________________________________________________________________________________________________________________________________________________________
_________________________________________________________________________________________________________________________________________________________
The Madden-Julian Oscillation (MJO) has been
shown to explain an important part of intraseasonal variations in the tropics.
The focus of this thesis is to study the impact of the MJO over South America
during austral summer. An index is constructed to make composite of different
MJO events. The data used are precipitation and winds at low and upper levels.
The main result is the presence of precipitation oscillation in eastern South
America (20ºS-0º, 35º-50ºW) during the MJO. These variations are associated
with changes of the cross-equatorial flow over South America and the low-level
jets (LLJs) in the subtropics to the east of the Andes. Analyses of composites
are performed to relate the variations of rainfall in eastern South America and
the low-level flow. Composites show also positive (negative) precipitation
variations in eastern South America occur at the same time with positive
(negative) variations in the eastern part of the South Pacific Convergence Zone
(SPCZ). This thesis studies a link between these two zones by a wave train.
_________________________________________________________________________________________________________________________________________________________
Chapter
1.
Introduction
The
Madden-Julian oscillation (MJO) dominates the intraseasonal variability with a
characteristic period of 30-60 days in the tropical circulation. It was
discovered by Madden and Julian (1971,1972) in rawinsonde and sea level
pressure data from the tropical oceans. This oscillation is a large-scale
episodic modulation of tropical winds and precipitation that travels eastward
from the Indian Ocean to the Pacific Ocean and sometimes up to the Atlantic
Ocean.
The MJO dynamics has been
studied for many years. Initial observational studies pointed out similarities
in the oscillation’s structure to that of an atmospheric Kelvin wave (Parker
1973). Some model simulations examined the possibility that the structure of
the oscillation is that of the response of the tropical troposphere to
localized heating. Yamagata and Hayashi (1984) forced the model of Gill (1980)
and found a Kelvin mode and Rossby modes to the east and west of the heating.
Most scientists generally agree on describing the MJO mechanism as a coupled
Kelvin-Rossby wave along the equator at upper levels (Wang and Rui 1990; Hendon
and Salby 1994, Maloney and Hartmann 1998). Classical equatorial Kelvin wave
theory indicates low-level easterlies (westerlies) are accompanied by a surface
pressure minimum (maximum) at the equator (Matsumo 1966) as shown in Figure 1. East of convection low-level easterlies associated
with the Kelvin waves are accompanied with frictional moisture convergence near
the surface. Wang and Rui (1990) showed that boundary-layer frictional moisture
convergence produces substantial portion of the wave energy. Therefore, there
is a moistening of the atmosphere east of the convection. For Maloney and
Hartmann (1998), convergence in the boundary layer due to friction plays a key
role in the evolution of the MJO. Inversely, west of convection low-level
westerlies associated with Rossby waves are accompanied with moisture
divergence, which dries the atmosphere. One of the current active areas of
research on the MJO is the connection with sea surface temperatures (SSTs).
Observations are characterized by high (low) SSTs on the east (west) of the
convection. Waliser et al. (1999) showed that the enhanced SSTs to the east of
the convection reinforce the meridional convergence, which transports more
low-level moisture into the region lying just east of convection.
Many studies of
this oscillation have been carried out to see its relationship with other
tropical phenomena. Yasunari (1980, 1981) suggested a connection between the
MJO and the Indian summer monsoon. Hartmann and Michelsen (1989) showed that
“break” periods of the Indian monsoon seemed to occur on intraseasonal
timescales, with strong indications of being phase-locked to the MJO events.
The impact of the MJO in the western hemisphere has been given less attention.
Gray (1988) and Kuhnel (1989) showed that the MJO tends to have a higher
frequency during El Nino-Southern Oscillation (ENSO) years. Maloney and
Hartmann (2000) studied the relationship of the MJO with hurricane genesis in
the Gulf of Mexico and the Caribbean Sea. The reason of this little interest is
due to the fact that convective anomalies are confined in the eastern
hemisphere (Hendon and Salby 1994). When convective centers go through the date
line, they meet colder water and tend to die. However, a careful look at OLR
(Outgoing Long Wave Radiation) plots reveals the presence of organized
convective anomalies over Central America and eastern South America. They are
smaller than the ones in the Indian and Western Pacific Oceans, but still
significant. For example, Maloney and Hartmann (1998) noticed positive
precipitation anomalies to the south of Mexico and Central America in their
composite study. Moreover, little work has been done studying the impact of the
MJO over South America because the Andes Cordillera appeared to block further
propagation of lower level anomalies (Maloney and Hartmann 2000).
The new concept
of South American monsoon permits to investigate this topic. Zhou and Lau
(1998) demonstrated the main features of the seasonal reversal of the
large-scale circulation over South America that resemble those of a monsoon
system when the annual mean winds are removed. Li and Fu (2002) found the onset
of the wet season in South America resembles that of the Asian monsoon
(Krishnamurti et al. 1998). Vera and Nobre (1999) showed evidence that the
relatively fast onset of convection over southeastern tropical South America
was associated with the MJO activity. The impact of the MJO over South America
is important because it permits a further understanding of South American
intraseasonal variations, which is an active area of research. An outstanding
feature of the warm season precipitation over much of the eastern and southern
Brazil is the high variability on time scales from a few days out to a few
weeks. Analysis of persistent wet and dry conditions over tropical and
subtropical eastern South America during the austral summer reveals a dipole
pattern of rainfall anomalies, with one center over southeastern Brazil in the
vicinity of the South Atlantic Convergence Zone (SACZ) and another center over
southern Brazil, Uruguay and northeastern Argentina (Casarin and Kousky 1986;
Nogues-Paegle and Mo 1997). Nogues-Paegle and Mo observed this dipole by making
composite of filtered OLR to retain variations longer than 10 days. They called
it the South American seesaw and suggested that it relates to the larger-scale
system MJO.
Over South
America, whether the dry and wet episodes on intraseasonal scale are
contributed by the MJO, as found for the Asian monsoon, has been controversial
in previous studies. This thesis aims to more thoroughly examine the possible
influence of the MJO on South America rainfall during austral summer. The
present study takes the similar composite technique elaborated by Maloney and
Hartmann (1998). However composites focus on austral summer to isolate the wet
season, whereas Maloney and Hartmann made composites for all seasons or for
boreal summer. Composites show strong precipitation anomalies in eastern South
America (20ºS-0º, 35-50ºW) throughout the MJO cycle. Positive (negative)
anomalies occur in the first (second) part of the cycle. The target of this
work is to investigate these rainfall variations and try to explain their
causes. Other features like the low-level cross-equatorial flow over South
America and the low-level jets (LLJs) east of the Andes reverse during the MJO
cycle. The cross-equatorial flow plays a role in rainfall activity in South
America by bringing moisture from the tropics to the Amazon region (Wang and Fu
2002 A). The cross-equatorial flow seems to be influenced by low-level zonal
winds at the equator, which are subject to strong variations with the MJO.
Another contributor to rainfall variations in eastern South America might be
the LLJs. They have been known as a moisture pipeline, bringing moist air from
the Amazon to higher latitudes in their northerly regime (Wang and Fu 2002 B,
Lenters and Cook 1999).
Composites
reveal the strengthening of the eastern part of SPCZ (South Pacific Convergence
Zone) is associated with rainfall increase in eastern South America. This
teleconnection has been observed by other studies (Nogues-Paegle and Mo 1997,
Mo and Nogues-Paegle 2001). These two authors computed EOF (Empirical
Orthogonal Function) from filtered (>10 days) OLR anomalies. They found
southward extension and strengthening of the SACZ was associated with enhanced
tropical convection over the central and eastern Pacific and dry conditions
over the western Pacific and the Maritime Continent. Simulations with a
barotropic model were conducted in this thesis to study the response of heating
in the eastern part of SPCZ. The model excites a wave train linking middle
Pacific to South America. The wave meets eastern South America and can be
responsible for rainfall variations in this region. Kalnay et al. (1986)
observed a similar wave during a study of short scale stationary Rossby waves
in the southern hemisphere.
The second
chapter of this thesis describes the data set. The third chapter explains the
methods used: the MJO composite, LLJ index and V index. The fourth chapter will
present and discuss the composites created and hypotheses will be made. The
fifth chapter will try to validate the wave train hypothesis using a barotropic
model.
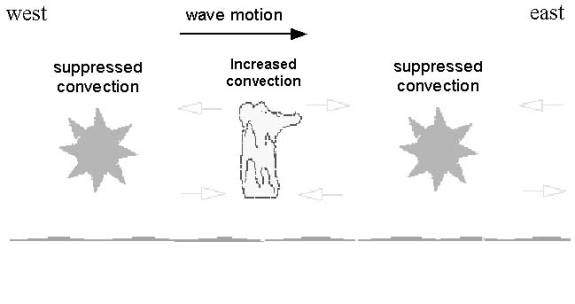
Figure
1: Schematic
structure of the MJO.
The data used
in this study consist of precipitation and two-dimensional atmospheric wind fields
at 925, 850 and 200-mb. They are taken from the European Center for
Medium-Range Weather Forecasts (ECMWF) reanalysis (ERA) on a 2.5º lat x 2.5º
long grid at 17 pressure levels. The original data were recorded 4 times daily
at 0000, 0600, 1200, and 1800 UTC, respectively, over a 15-year period
(1979-93). The data were converted in pentad format (5 day mean) to facilitate
the manipulation.
GPCP (Global
Precipitation Climatology Project) is another dataset for precipitation. It is
obtained by merging infrared and microwave satellite estimates of precipitation
with rain gauge data from more than 30,000 stations. These data have the same
characteristics than ERA ones (spatial resolution, year covered) except that
they are daily. Li and Fu (2002) made a comparison between three datasets: ERA,
GPCP and raingauges over South America. Figure 2, taken
from their paper, was obtained by averaging data over the Amazon basin and
taking the 15-year mean (1979-93) for each pentad. This shows that the three
datasets follow the same trend. Differences between datasets are reduced when
the climatology annual mean is removed. In austral summer, ERA tends to
underestimate precipitation, whereas GPCP better follows raingauges. Figure
3a represents the basic state of precipitation
over South America during austral summer (averages taken over 15 austral
summers, December to February) using ERA data. The pattern reveals some
localized high precipitations in the extratropics along the Andes (>20
mm/day at 32ºS and 50ºS), which is not consistent with observations. In the
tropics the maximum value is 20 mm/day and it is located around 48ºW, 7ºS. This
value is questionable because it is a factor of two higher than the Amazon basin.
The accuracy of precipitation data in eastern South America is very important
here, because precipitation variations due to the MJO are maximized in this
region. Figure
3b is the same than Figure 3a but for GPCP.
This dataset is smoother than ERA, without localized high values in the
extratropics. In the tropics values around 48ºW, 7ºS stay in the same range
than in the Amazon basin. Thus, GPCP is more accurate to depict rainfall over
South America and it is the dataset used in this thesis rather than ERA.

Figure
2: Comparison of
ERA, GPCP and raingauges over the Amazon basin.
Figure
3: Climatology of precipitation
for 15 austral summer (DJF), 1979-1993 from ECMWF and GPCP data. Contour
interval is 3 mm/day.
The composite method was taken from Maloney and
Hartmann (1998). Here is a brief explanation. The MJO occurs in the tropics and
propagates eastward. The zonal wind at 850-mb averaged from 5ºN to 5ºS well
represents the oscillation and is used to build the MJO index. This oscillation
has a characteristic period of 30-60 days, and then the zonal wind is filtered
to isolate variations due to the MJO. At first Maloney and Hartmann used 20-80
days bandpass-filtering in 1998 and then adjusted to 30-90 days in their later
papers (Maloney and Hartmann 2000). The 30-90 days bandpass-filtering was more
accurate to represent the oscillation and that is the one used here. EOF
(Empirical Orthogonal Function) analysis is done on the resulting filtered
equatorially averaged zonal wind for the entire 1095 pentad record (1979-1993).
The following Figure represents EOF1 and EOF2 as a function of longitude.
Figure 4:
EOF1 and EOF2.
This
Figure has the same characteristic as Figure 1 produced by
Maloney and Hartmann (1998). EOF1 explains 34% of the total bandpass-filtered
variance, while EOF2 explains 24%. These results are very close to Maloney’s
with less than 2% difference. EOF1 peaks in the Indian Ocean (around 80ºE), and
EOF2 in the western Pacific (around 150ºE). An index is constructed in the
following manner, where t is time in pentad:
Index
(t) = PC1 (t) + [PC2 (t+2) + PC2 (t+3)]/2
The index is a linear combination
of the principal components (PCs) of EOF1 and EOF2. Since PC2 peaks an average
of 2–3 pentads after PC1, contributions from PC2 both 2 and 3 pentads later are
added to PC1 in order to form the index. The time at which the index is at a
maximum is when a region of maximum convergence of the 850-mb zonal wind
anomalies is centered at about 130ºE.
The time variation of the index is that of
an oscillating pattern. Key events were determined by choosing events that had
peak amplitudes greater than one standard deviation away from zero. Periods in
which the index did not have succeeding positive and negative anomalies were
ignored. As a result of this selection criterion, 71 events were isolated
during the period 1979–93 for all seasons, whereas Maloney and Hartmann found
81 events for the period from 1979-1995. Table 1 shows the classification of
events as a function of season (each season is defined as three month long).
Season
|
Number of events
|
|
Spring
MAM
|
22
|
|
Summer
JJA
|
16
|
|
Fall
SON
|
18
|
|
Winter
DJF
|
15
|
|
All
season
|
71
|
Table 1: Number of MJO events as
a function of season for 1979-1993.
Once
the events were isolated, they were broken into nine different phases. Phase 5
was designated the time in each event at which the index had maximum peak
amplitude. Phase 1 and phase 9 were given to the times in each event with
largest trough amplitude before and after phase 5, respectively. Phases 3 and 7
were given to the zero increasing and zero decreasing points in each event, and
the other phases were placed equidistant in time between phases 1, 3, 5, 7, and
9. Events were then averaged together to produce a composite event for each
season.
The South
American low-level circulation is unique and complex due to the topography of
the Andes Cordillera. Focusing on the meridional circulation, two main features
are: the South American low-level jets (LLJs) and the low-level
cross-equatorial flow.
LLJs are located to the east of the Andes in the
subtropics. They act as a moisture pipeline linking the Amazon to central South
America (Paegle 1998). They influence precipitation especially during austral
summer. Wang and Fu (2002 B) constructed an index, the so-called LLJ index, to
represent the variability of the LLJs, based on area-averaged in a parallelogram
longitudinally bounded by (62.5°-72.5°W) at 10°S and (52.5°-62.5°W) at 20°S.
Wang and Fu showed the associations between precipitation and the LLJs are
stronger in austral summer than other seasons. In a northerly regime the flow
takes moisture from the Amazon basin to higher latitudes, which increase
precipitation around 30ºS and decrease them in the Amazon basin.
The second
feature is the low-level cross-equatorial flow over South America. Wang and Fu
(2002 A) found that South American precipitation is highly correlated with this
flow. In a similar way as for LLJs an index, the V index was constructed based
on area-averaged (5°S–5°N, 65°–75°W) daily mean 925-hPa meridional winds. When
the V index is southerly, precipitation is mainly confined to the north of the
equator. When the V index is northerly, precipitation is shifted toward the
Amazon. The cross-equatorial flow is dominated by the northerly (southerly)
regime in austral summer (winter). The seasonal variations of South American
precipitation, as well as the onset of the Amazon rainy season, are strongly
related to the changes in direction of the cross-equatorial flow and the
frequency of these southerly and northerly wind events.
Wang and Fu
(2002 B) found negative correlations between LLJ index and V index in austral
summer. It suggests that southerly LLJs in the subtropics are associated with
northerly V index in the tropics, both of which favor summer precipitation over
Amazon basin.
Austral summer corresponds to the wet season over
South America. The study of rainfall variations during this period is important
to determine the occurrence of active and break periods of rainfall and
possibilities of floods. Figure 5a represents the basic
state of precipitation and 850-mb flow during austral summer (average taken
over 15 austral summers). Wet season spreads over equatorial-tropical South
America and extends to the southeast in the Atlantic Ocean, a region called the
South Atlantic Convergence Zone (SACZ). In the Pacific Ocean, the South Pacific
Convergence Zone (SPCZ) is the region of strong rainfall that extends from the
Maritime Continent to the southeast up to 120ºW. The Inter-Tropical Convergence
Zone (ITCZ) is the band of rainfall along the equator in the Atlantic and
Pacific Oceans. An anticyclone is present in south Atlantic and creates
northerly LLJs. Trade winds blow from east to west along the equator. A part of
this flow is deflected to the south by the Andes and makes the cross-equatorial
flow in a northerly regime as observed by Wang and Fu (2002 A). Figure
5b is the same as Figure 5a but for 200-mb flow. The circulation presents
some well-defined regional scale circulation systems such as the upper
tropospheric large anticyclone centered over Bolivia (so called Bolivian High),
and a trough over northeast Brazil in the upper troposphere (Virji 1981; Kousky
and Gan 1981). The basic austral summer flow and precipitation have been
described, and then anomalies will be studied in the composites.
Figure
5: Climatology of
850 and 200-mb (streamlines) and precipitation (contour interval is 3 mm/day)
for 15 austral summer (1979-1993).
The following
Figures (6-11) detail the evolution of a composite cycle of the MJO for austral
summer. Wind fields and precipitation were bandpass-filtered to 30-90 days.
Wind streamlines at 850-mb are displayed along with precipitation (Figures 6-8)
and wind vectors at 200-mb are displayed by themselves (Figures 9-11). In order
to familiarize the reader with a MJO cycle, here is a brief description of the
evolution of the convective anomalies during the cycle. However, for a more
detailed description the reader should refer to Maloney and Hartmann (1998).
During phases 1-3, a convective system forms over western Indian Ocean and
grows as it propagates eastward (not shown on Figures). In phase 4, it is over the
maritime continent and is visible on Figure 6 at 120ºE. As
it reaches a longitude of 130ºW in phases 7 and 8, the convective system stops
its eastward propagation and then shifts to higher latitudes (30ºS) in phases 8
and 9. During phases 1 and 2, the remnants of the previous MJO cycle are the
positive precipitation anomalies decreasing around 130ºW. During phases 1- 3
(6-8) there are positive (negative) precipitation anomalies over eastern South
America. The objective of our composite study is to investigate precipitation
variations in this area.
Figure
6: Composite of
850-mb wind (streamlines) and precipitation (contour) bandpass-filtered 30-90
days for phases 1-3 of the MJO in austral summer.
Figure
7: Same as Figure 6
for phases 4-6.
Figure 8:
Same as Figure 6 for phases 7-9.
Figure 9:
Composite of 200-mb wind (vectors) bandpass-filtered 30-90 days for phases 1-3
of the MJO in austral summer.
Figure 10:
Same as Figure 9 for phases 4-6.
Figure 11:
Same as Figure 9 for phases 7-9.
- Phases 1-3
Strong negative precipitation anomalies propagate
from the maritime continent to western Pacific along the equator. On the
eastern (western) side, there are westerlies (easterlies) at low-level and
easterlies (westerlies) at upper level, as expected from the anomalous wind
patterns associated Kelvin wave theory. In the Pacific, low-level westerlies
extend to South America where they are slightly deflected to the north by the
Andes. The flow quickly turns to the south over South America, joining the
northerly anomalies of the cross-equatorial flow. Just after crossing the
equator the flow retakes a quasi-zonal direction over the eastern part of South
America, where there are positive rainfall anomalies. The cross-equatorial flow
brings moist air from the equatorial region to eastern South America, which
probably increases rainfall.
In middle
Pacific, the remnants of positive convective anomalies from the previous MJO
cycle decrease, until disappearing in phase 3. At 850-mb a cyclone is present
over southern Brazil with a center located around 50ºW, 20ºS. This region seems
to be linked to middle Pacific by a wave train represented by a succession of
cells of opposite sense of rotation between 30º-60ºS. The cyclone over southern
Brazil makes southerly anomalies of LLJs.
- Phase 4-6
In the Pacific, negative precipitation anomalies
have shifted southeastward up to 120ºW, 30ºS where they decrease. In the
tropics, 850-mb westerlies reverse first in eastern Pacific and then over South
America in phase 6. This flow curves to the north to avoid the Andes, and makes
southerly cross-equatorial flow anomalies. Positive precipitation anomalies in
eastern South America are replaced by negative ones. The changes encountered by
the eastern part of SPCZ seem to have affected the wave train. First it has
been suppressed, and then it has reappeared in phase 6 with cells rotating in
an opposite sense. A low-level anticyclone has installed over southern Brazil,
making northerly anomalies of LLJs. At the same time, strong positive rainfall
anomalies develop in western Pacific.
c. Phase
7-9
Positive rainfall anomalies propagate to central
Pacific. It modifies low-level easterlies in eastern Pacific, until reversal in
phase 9. It is associated with suppressing of southerly anomalies of the
cross-equatorial flow, as well as negative precipitation anomalies in eastern
South America. Extinction of negative rainfall anomalies around 130ºW is
accompanied with a modification of the wave pattern reducing its impact over
southern Brazil. The consequence is a weakening of low-level anticyclone, as
well as LLJs anomalies.
Figure 12
represents composites of eastern South American precipitation (area-averaged
35º-55ºW, 0º-30ºS), V and LLJ index as a function of the 9 phases of the MJO
for austral summer. This clearly shows that the MJO affects South America.
There is a systematic relationship between the three variables. Increase
(decrease) of precipitation is associated with northerly (southerly) V index
and southerly (northerly) LLJs, except for phases 4 and 9. Phases 2 and 6 are
two opposite situations where precipitation, V and LLJ index have significant
values. Figure 13 represents composites of precipitation and
low-level flow for these two phases. In phase 2, there is a strong convergence
between LLJs and the cross-equatorial flow. The cold air from the pole tends to
lift the warm and moist flow from the tropics. This lifting, enhanced by the
presence of the terrain elevation in eastern South America (see Figure
14), seems to be responsible for the positive precipitation anomalies in
eastern South America. Inversely in phase 6 the strong divergence, between the
southerly cross-equatorial flow and northerly LLJs, makes negative rainfall
anomalies in this same region.
LLJ index leads
changes of precipitation (V index) at phases 4 and 9 (4), the transition
phases. LLJ index peaks at phase 6, whereas precipitation and V index peak one
phase later. The leading of LLJ index suggests that LLJs variations cause
variations of precipitation and cross-equatorial flow.
Figure 12:
Eastern South American precipitation, V and LLJ index as a function of the 9
phases of the MJO.
Figure
13: Composite of
850-mb wind (streamlines) and precipitation (contour) bandpass-filtered 30-90
days for phases 2 and 6 of the MJO in austral summer.

Figure
14: Terrain
elevation contoured every 500 m.
MJO rainfall anomalies grow and develop as they
move from the Indian Ocean to western Pacific along the equator. They stop
their progression around 125ºW, where they meet colder SSTs. Then convection
anomalies shift to the south (30ºS) and they decrease until disappearing. There
are no signs of rainfall anomalies in eastern Pacific but there are in eastern
South America. These systematic changes do not only concern precipitation but
also, the low-level cross-equatorial flow over South America and the LLJs east
of the Andes. The question we address is the causes of these systematic
variations over South America.
Based on Figure 12, LLJ index
leads precipitation and V index (at phases 4, 6 and 9). Thus changes of LLJ may
cause changes of precipitation in eastern South America and low-level
cross-equatorial flow. This point is supported by other studies, which showed
LLJs influence precipitation over South America. Nogues-Paegle and Mo (1997)
observed that in a northerly regime, LLJs promote rainfall over southern Brazil
and northern Argentina, while decreasing rainfall in eastern South America and
SACZ; and inversely in a southerly regime. The correlation between LLJ index
and precipitation over South America, done by Wang and Fu (2002 B) for the
month of January, was reproduced here as Figure 16b.
Maximum positive values are located in eastern South America, supporting that
southerly LLJs increase precipitation over eastern South America.
The composites’ study in section 4.2 revealed that
LLJs were a component of a cyclone or anticyclone over southern Brazil and
northern Argentina. This cyclone/anticyclone seems to be a part of a larger
scale system, a wave train extending from middle Pacific to South America at
high latitudes visible at 850-mb (see Figures 6 and 7). At 200-mb, streamfunctions obtained from the composites
were plotted in Figure 15 for phases 1 and 5, to represent
more clearly the wave at the upper level. Kalnay et al. (1986) observed similar
wave pattern and noticed its occurrence when SPCZ is shifted eastward from its
climatological position. Based on this observation, Grimm and Silva Dias (1995)
did numerical simulations to study the response of heating located in the
eastern part of SPCZ. They found a wave train rounding the southern tip of
South America and turning toward the northeast. The model simulates upper level
convergence over South America around 30ºS, as seen in phase 2 of our
composites in Figure 9. Therefore, the wave train helps to
explain variations of LLJs. Now we need to answer what causes variations of the
low-level cross-equatorial flow.
Zonal flow anomalies in equatorial eastern Pacific
seem to impact the cross-equatorial flow. From the composite study of section
4.2, low-level westerlies (easterlies) are associated with northerly
(southerly) anomalies of the cross-equatorial flow. The Andes Cordillera is
about 2000 m high in the tropics (see Figure 14) and
low-level flow cannot go through. Equatorial winds avoid them by turning to the
north or to the south. When the equatorial flow is easterly the branch that
curves to the north makes southerly cross-equatorial flow anomalies. In the
case of westerly equatorial flow, the part of the flow that curves to the north
is deflected back to the south after avoiding the Andes, which makes northerly
cross-equatorial flow anomalies. These two situations are clearly shown in Figure 13. Another factor that can influence the
cross-equatorial flow is the precipitation in eastern South America. This point
is suggested by Figure 12, which shows that V index lags
precipitation at phase 3. Thus precipitation changes in eastern South America
might cause changes of the low-level cross-equatorial flow. For example, can an
increase of rainfall in eastern South America induce or enhance northerly V
index? The work of Kleeman (1989) partially answers this question. He used a
two-level model and studied the response of heating located to the east of the
Andes (centered around 15ºS and 60ºW). The model predicted low-level northerly
cross-equatorial flow. Even if the heating location is 10º to the west where
precipitation anomalies are in eastern South America in the composites, it can
still be applicable. This point is also supported by the fact that negative
correlations, between V index and precipitation, are all over eastern South
America as depicted in Figure 16a (taken from Wang and Fu
2002 A).
Figure 15:
Composite of 200-mb wind streamfunction bandpass-filtered 30-90 days for phases
1 and 5 of the MJO in austral summer.
Contour is 100 m^2/s
Figure 16:
Linear regression coefficient for January daily precipitation associated with
the 15-year daily mean V and LLJ index. Unit contour is mm.day^-1.(m s^-1)^-1.
A steady-state
barotropic model is used to assess the remote atmospheric response to a
tropical heating source in the upper level (200-mb). The model consists of a
steady barotropic vorticity equation:
 ,
,
where f is the Coriolis parameter, ζ the vorticity, V
the horizontal wind vector,  is biharmonic
diffusion coefficient, and ε is Rayleigh friction.
is biharmonic
diffusion coefficient, and ε is Rayleigh friction.
This equation is linearized about
a climatological mean state (e.g., Ting 1996) and applied at 200-mb.
 ,
,
where bar represents the zonal mean variables and prime
the deviation from that zonal mean state. Here  and
and  are the rotational
and divergent wind components, respectively. They are defined as follows:
are the rotational
and divergent wind components, respectively. They are defined as follows:
 ,
,  ,
,
 ,
,  .
. 

The solution is obtained by a
conjugate-gradient method (Navon and Legler 1987) with a specified basic state
and an anomalous divergence field, which is defined as the forcing of the
barotropic model induced by diabatic heating.
The composite
analysis study has suggested changes of the eastern part of SPCZ may impact on
eastern South America. This hypothesis is examined with the steady state
barotropic model. The basic state wind field at 200-mb during austral summer
(average taken for 15 months of January from 1979 to 1993) is used as input of
the model. The heating forcing is located in the middle of the Pacific Ocean
and its shape matches positive (negative) rainfall anomalies of phase 1 (5) of
the MJO (see Figures 6 and 7). It has
an elliptical shape centered at (150°W, 17.5°S). Figure 17a
shows the location and the intensity of the forcing (upper level divergence).
The intensity of the forcing is arbitrary. After reaching its equilibrium,
model outputs are streamfunctions at 200-mb as presented in Figure
17b. In the southern hemisphere four cells of opposite streamfunctions
values extend from Pacific to South America. Two of them are located in the
Pacific Ocean. Another one is centered at 70°W, 60°S over the southern part of South
America. The last one covers the SACZ. These four cells seem to form a wave
train linking SPCZ to eastern South America, as observed in phases 2 and 6 at
850-mb (see Figures 6 and 7) and as
observed in phases 1 and 5 at 200-mb (see Figure 15). Here
it is necessary to say that the model streamfunction values cannot be compared
to the real streamfunctions values of Figure 15 because the intensity of the
forcing is arbitrary; however we can discuss the general pattern. In eastern
South America streamfunction values are high even if this region is 120° east
of the forcing zone. The influence of the forcing is important and could be
responsible for LLJs anomalies and precipitation anomalies observed in the
composites. These results are similar to the one obtained by Grimm and Silva
Dias (1995) (see their Figure 12d). A second simulation was done with a similar
forcing shifted 60° to the west. Both forcing location and outputs of the model
are presented in Figure 18a. The four cells are visible,
but they have lower streamfunction values (factor 0.5). The cell previously
over SACZ has moved approximately 60° to the west and is now over eastern
Pacific. Effects of the forcing over South America have been mainly suppressed.
These two simulations show the wave sensitivity to the forcing location. It is
only the modifications of the eastern part of SPCZ that impacts over South
America.
Figure
17: (a) Upper level
divergence of the forcing. Contour interval is 2e-7 s-1. (b) Streamfunction at
200-mb. Contour is 20 m^2/s.
Figure 18: Same as Figure 17 but
for a forcing location shifted 60º to the west.
A third simulation, using a time dependant
barotropic model, is done to study the timescale of the wave. An identical
forcing over the eastern part of SPCZ is used. Figure 19
represents the evolution of streamfunctions at 200-mb for a 20 day simulation,
and streamfunctions are plotted every two days. At day 2, negative
streamfunctions are located in western Pacific around the forcing region. Two
days later a cell of opposite streamfunction values installs over eastern
Pacific. At day 8, a first cell appears over western Atlantic Ocean and eastern
South America and slightly shifts toward South America during the two following
days. At day 12, a negative streamfunction cell blossoms around the southern
tip of South America. At day 14, a general pattern similar to the one obtained
with the steady state barotropic model is observed, which means the time
dependant model has reached its equilibrium. The conclusion from this
simulation is the wave extends eastward from the forcing region and reaches
SACZ around eight days later. Therefore the forcing in eastern part of SPCZ
impacts over eastern South America in a time scale of one to two pentads. This
result agrees with our composites.
Figure 19:
200-mb streamfunction output of the time dependant model.
Intraseasonal variations over South America during austral
summer are the focus of this dissertation. A MJO composite analysis shows
significant variations of rainfall over eastern South America, variations of
the low-level cross-equatorial flow over South America and variations of the
low-levels jets (LLJs) east of the Andes. The question we addressed is the
causes of these variations.
The mechanism we propose has multiple parts. On one
hand, the low-level equatorial zonal flow interacts with the Andes Cordillera
and is deflected in a meridional direction. The resulting variations of the
cross-equatorial flow over South America impact the moisture transport from the
equator to higher southern latitudes. On the other hand, the MJO convective
cells that are suppressed over middle Pacific modify the eastern part of SPCZ.
The high sensitivity of this region results in the excitement of a wave train
linking middle Pacific to South America. This wave train seems to be
responsible for the formation of a low-level cyclone or anticyclone over
southern Brazil and Argentina. It results in anomalies of the LLJs east of the
Andes. In a southerly regime this flow brings cold air from the pole to the
tropics, whereas it takes moisture away from the tropics in a northerly regime.
The negative correlation between the cross-equatorial flow and the LLJs creates
an exceptional situation. In one case there is a strong convergence between the
two flows around 15ºS (northerly cross-equatorial flow associated with
southerly LLJs). In this region the cold LLJs from the pole tends to lift the
moist and warm cross-equatorial flow. It seems to result in precipitation over
eastern South America. In the second case, the divergence between the two
low-level flows produces negative rainfall anomalies.
This mechanism has some feedbacks. Positive
precipitation anomalies in eastern South America tend to increase northerly
anomalies of the cross-equatorial flow, which brings more moisture from the
tropics and increase precipitation in eastern South America. This positive
feedback loop between precipitation and eastern South American is also
controlled by other factors: equatorial zonal flow in eastern Pacific, LLJs
anomalies, which do not permit a continuous increase of precipitation and V
index.
Future work will imply a validation of the wave theory
using a more sophisticated model (like a Global Circulation Model). Another
research interest will be to study these intraseasonal variations over South
America during ENSO years.
_________________________________________________________________________________________________________________________________________________________
Casarin,
D. P., and V. E. Kousky, 1986: Precipitation anomalies in the southern part of
Brazil and variations of the atmospheric circulation. Rev. Bras. Meteor.,
1, 83-90.
Gill, A. E.,
1980: Some simple solutions for heat-induced tropical circulation. Quart. J.
Roy. Meteor. Soc, 106, 447-462.
Gray, B. M.,
1988: Seasonal frequency variation in the 40-50 day oscillation. J. Climatol.,
8, 511-519.
Grimm, A. M., and
P. Silva Dias, 1995: Analysis of tropical-extratropical interactions with
influence functions of a barotropic model. Gray, B. M., 1988: Seasonal
frequency variation in the 40-50 day oscillation. J. Climatol., 52,
3538-3555.
Hartmann, D. L.,
and M. L. Michelsen, 1989: Intraseasonal periodicities in Indian rainfall. J.
Atmos. Sci., 46, 2838-2862.
Hendon,
H. H., and M. Salby, 1994: The life cycle of the Madden-Julian Oscillation. J.
Atmos. Sci., 51, 2225-2237.
Kalnay,
E., Kingtse C. Mo, and J. Paegle, 1986: Large-amplitude, short-scale stationary
Rossby waves in the southern hemisphere: Observations and mechanistic
experiments to determine their origin. J. Atmos. Sci., 43,
252-275.
Kousky,
V. E., and M. A. Gan, 1981: Upper tropospheric cyclonic vortices in the tropical
south Atlantic. Tellus, 33, 538-550.
Khunel,
I., 1989: Spatial and temporal variation in Australian-Indonesian region
cloudiness. Int. J. Climatol., 9, 1451-1460.
Krishnamurti,
T. N., M. C. Sinha, B. Jha, and U. C. Mohanty, 1998: A study of South Asian
monsoon energetics. J. Atmos. Sci., 55, 2530-2548.
Lenters,
J. D., and K. Cook, 1999: Summertime precipitation variability over South
America: role of the large-scale circulation. Mon. Wea. Rev., 127,
409-431.
Li,
W., and R. Fu, 2002: Transition of the Large-scale Atmospheric and Land Surface
Conditions from Dry to Wet Seasons over Amazon. Submitted to J. Climate.
Madden,
R. A., and P. Julian, 1971: Detection of a 40-50 day oscillation in the zonal
wind in the tropical Pacific. J. Atmos. Sci., 28, 702-708.
Madden,
R. A., and P. Julian, 1972: Description of global scale circulation cells in
the tropics with a 40-50 day period. J. Atmos. Sci., 29,
1109-1123.
Madden,
R. A., and P. Julian, 1994: Observations of the 40-50-day tropical
oscillation-A review. Mon. Wea. Rev., 122, 814-837.
Maloney,
E. D., and D. L. Hartmann, 1998: Frictional moisture convergence in a composite
life cycle of the Madden-Julian Oscillation. J. Climate, 11,
2387-2403.
Maloney,
E. D., and D. L. Hartmann, 2000: Modulation of eastern north Pacific hurricanes
by the Madden-Julian Oscillation. J. Climate, 13, 1451-1460.
Matsuno,
T., 1966: Quasi-geostrophic motions in the equatorial area. J. Meteor. Soc.
Japan, 44, 25-43.
Mo,
K. C. and J. Nogues-Paegle, 2001: The Pacific-South American modes and their
downstream impact. International J. of Climatology.
Navon,
I. M., and D. M. Legler, 1987: Conjugate-gradient methods for large-scale
minimization in meteorology. Mon. Wea. Rev., 115,1479-1502.
Nogues-Paegle,
J. and K.C. Mo, 1997: Alternating wet and dry conditions over South America
during summer. Mon. Wea. Rev., 125, 279-291.
Paegle,
J., 1998: A comparative review of South American low-level jets. Meteorologica,
23, 73-81.
Parker,
D. E., 1973: Equatorial Kelvin waves at 100 millibars. Quart. J. Roy.
Meteor. Soc., 99, 116-129.
Salby,
M. L., and H. H. Hendon, 1994: Intraseasonal behavior of clouds, temperature,
and motion in the Tropics. J. Atmos. Sci., 51, 2220-2237.
Ting
M., 1996: Linear response to tropical heating in barotropic and baroclinic
models. J. Atmos. Sci., 53, 1698-1709.
Vera,
C. and C. Nobre, 1999: On the dynamics associated with the onset of the wet
season in Central and Southeastern Brazil. 2nd session of the
CLIVAR/VAMOS Panel. WCRP Report, No 9/99, ICPO Report No 30.
Virji,
H., 1981: A preliminary study of Summertime Tropospheric Circulation Patterns
over South America estimated from clouds winds, Mon. Wea. Rev., 109,
599-610.
Waliser,
D. E., K. Lau, and J. Kim, 1999: The influence of coupled sea surface
temperatures on the Madden-Julian Oscillation: a model perturbation experiment.
J. Atmos. Sci., 56, 333-358.
Wang,
B., and H. Rui, 1900: Dynamics of the coupled moist Kelvin-Rossby wave on an
equatorial β plane. J. Atmos. Sci., 47, 397-413.
Wang, H., and R. Fu, 2002 A: Cross-Equatorial Flow and Seasonal
Cycle of Precipitation over South America. Ting M., 1996: Linear response to
tropical heating in barotropic and baroclinic models. J. Atmos. Sci., 53,
1698-1709.
Wang, H., and R. Fu, 2002 B: Influence of cross-Andes flow on
the South American low-level jets. J. Climate (submitted).
Yamagata, T., and Y, Hayashi, 1984: A simple diagnostic model
for the 30-50 day oscillation in the tropics. J. Meteor. Soc. Japan, 62,
709-717.
Yasunari, T., 1980: A quasi-stationary appearance of the 30-40
day period in the cloudiness fluctuations during the summer monsoon over India.
J. Meteor. Soc. Japan, 58, 225-229.
Yasunari, T., 1981: Structure of an Indian summer monsoon
system with around 40-day period. J. Meteor. Soc. Japan, 59,
336-354.
Zhou, J., and K.-M. Lau, 1998: Does a monsoon climate exist
over South America? J. Climate, 11, 1020-1040.